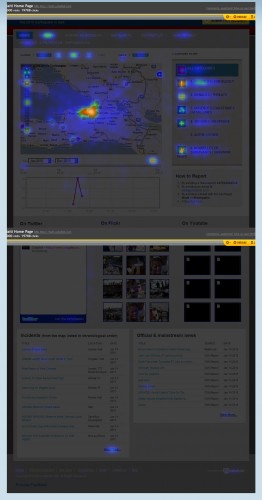
We're trying to measure the homepage of Haiti.Ushahidi.com - to do this we needed to understand better how people use the site, so we applied a heatmap to see what people actually do on the page.
[caption id="attachment_1238" align="aligncenter" width="262" caption="The Haiti Ushahidi site - a heatmap"] [/caption]
There are a number of takeaways from the heatmap. Right off the bat we had a couple, though we'll likely have a lot more when we have a few minutes to actually study it:
 [/caption]
There are a number of takeaways from the heatmap. Right off the bat we had a couple, though we'll likely have a lot more when we have a few minutes to actually study it:
- It further solidifies our drive to get a "fullscreen" feature up and running, most of the action is on the map and we can do a lot to give it more prominence.
- We used the stats to make the decision to take off the "Share This" button, which gave us room to add "Total Reports: xxx
- People seem to like hitting the "Play" button to see the action take place over time. We'll need to refine that feature so that it plays a lot smoother.